Current Team Rankings
Standings
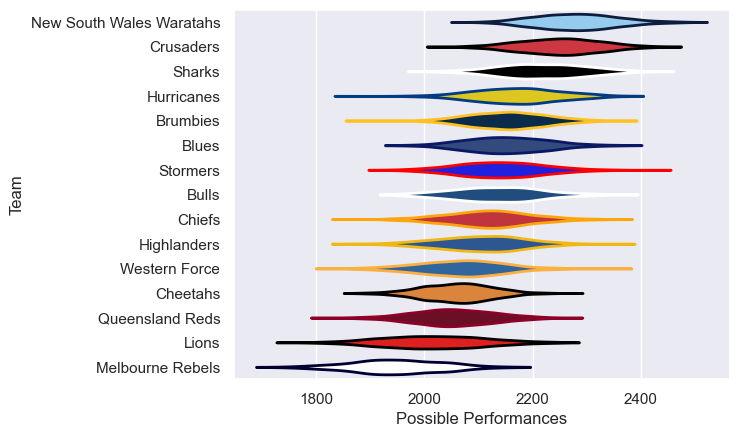
Current Standings
| Club | Played | Wins | Point Differential | Losing Bonus Points | Try Bonus Points | Competition Points |
|---|---|---|---|---|---|---|
| New South Wales Waratahs | 18 | 14 | 228 | 1 | 9 | 66 |
| Crusaders | 18 | 12 | 154 | 4 | 5 | 57 |
| Sharks | 18 | 12 | 85 | 4 | 2 | 54 |
| Brumbies | 18 | 11 | 18 | 1 | 5 | 50 |
| Chiefs | 17 | 8 | 4 | 4 | 6 | 46 |
| Highlanders | 17 | 8 | -45 | 6 | 5 | 43 |
| Hurricanes | 16 | 8 | 65 | 3 | 6 | 41 |
| Western Force | 16 | 9 | -52 | 1 | 3 | 40 |
| Bulls | 16 | 7 | 30 | 5 | 3 | 38 |
| Blues | 16 | 7 | 26 | 3 | 6 | 37 |
| Stormers | 16 | 7 | -36 | 2 | 2 | 32 |
| Lions | 16 | 7 | -46 | 1 | 2 | 31 |
| Queensland Reds | 16 | 5 | -119 | 4 | 4 | 28 |
| Cheetahs | 16 | 4 | -155 | 3 | 3 | 24 |
| Melbourne Rebels | 16 | 4 | -157 | 4 | 1 | 21 |
Completed Match Review
| Model | Percent Correct Predictions | Spread Error |
|---|---|---|
| Club Level | 71.2% | 11.1 |
| Player Level: Lineup | nan% | nan |
| Player Level: Minutes | nan% | nan |