Current Team Rankings
Standings
Current Standings
| Club | Played | Wins | Point Differential | Losing Bonus Points | Try Bonus Points | Competition Points |
|---|---|---|---|---|---|---|
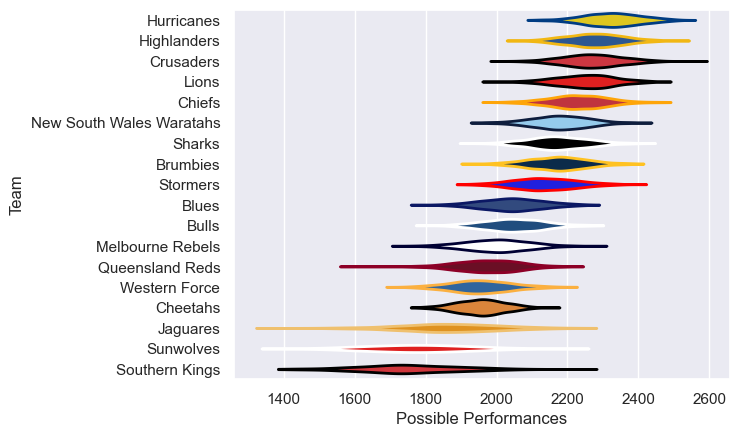
| Hurricanes | 18 | 14 | 218 | 2 | 10 | 68 |
| Lions | 18 | 13 | 198 | 1 | 12 | 65 |
| Chiefs | 17 | 12 | 173 | 1 | 11 | 60 |
| Highlanders | 17 | 12 | 143 | 4 | 7 | 59 |
| Crusaders | 16 | 11 | 153 | 1 | 7 | 52 |
| Stormers | 16 | 10 | 127 | 4 | 4 | 50 |
| Brumbies | 16 | 10 | 93 | 1 | 6 | 47 |
| Sharks | 16 | 9 | 50 | 3 | 4 | 45 |
| Bulls | 15 | 9 | 60 | 0 | 6 | 44 |
| New South Wales Waratahs | 15 | 8 | 96 | 4 | 7 | 43 |
| Blues | 15 | 8 | -6 | 3 | 4 | 41 |
| Melbourne Rebels | 15 | 7 | -121 | 1 | 8 | 37 |
| Cheetahs | 15 | 4 | -48 | 4 | 4 | 24 |
| Jaguares | 15 | 4 | -51 | 5 | 3 | 24 |
| Queensland Reds | 15 | 3 | -168 | 3 | 2 | 19 |
| Western Force | 15 | 2 | -181 | 5 | 1 | 14 |
| Sunwolves | 15 | 1 | -334 | 3 | 4 | 13 |
| Southern Kings | 15 | 2 | -402 | 0 | 2 | 10 |
Completed Match Review
| Model | Percent Correct Predictions | Spread Error |
|---|---|---|
| Club Level | 71.1% | 12.9 |
| Player Level: Lineup | nan% | nan |
| Player Level: Minutes | nan% | nan |