Team Rankings
Standings
Current Standings
| Club | Played | Wins | Point Differential | Losing Bonus Points | Try Bonus Points | Competition Points |
|---|---|---|---|---|---|---|
| Hurricanes | 16 | 13 | 354 | 2 | 13 | 67 |
| Chiefs | 16 | 13 | 249 | 1 | 12 | 65 |
| Crusaders | 16 | 9 | 84 | 4 | 13 | 53 |
| Blues | 16 | 8 | -13 | 2 | 12 | 46 |
| Brumbies | 15 | 7 | -25 | 4 | 9 | 41 |
| Queensland Reds | 15 | 8 | -44 | 2 | 7 | 41 |
| Western Force | 14 | 7 | -25 | 1 | 7 | 36 |
| New South Wales Waratahs | 14 | 5 | -49 | 4 | 5 | 29 |
| Highlanders | 14 | 5 | -97 | 3 | 6 | 29 |
| Fijian Drua | 14 | 5 | -143 | 1 | 8 | 29 |
| Moana Pasifika | 14 | 2 | -291 | 1 | 2 | 11 |
Projected Remaining Table
| Club | To Play | Projected Wins | Projected Differential | Projected Losing Bonus Points | Projected Try Bonus Points | Projected Competition Points |
|---|---|---|---|---|---|---|
| Hurricanes | 1 | 0.695 | 4.614 | 0.173 | 3.041 | |
| Chiefs | 1 | 0.261 | -4.614 | 0.327 | 1.459 |
Projected Total Table
| Club | Played | Wins | Point Differential | Losing Bonus Points | Try Bonus Points | Competition Points |
|---|---|---|---|---|---|---|
| Hurricanes | 17 | 13.695 | 358.614 | 2.173 | 13 | 70.041 |
| Chiefs | 17 | 13.261 | 244.386 | 1.327 | 12 | 66.459 |
| Crusaders | 16 | 9 | 84 | 4 | 13 | 53 |
| Blues | 16 | 8 | -13 | 2 | 12 | 46 |
| Brumbies | 15 | 7 | -25 | 4 | 9 | 41 |
| Queensland Reds | 15 | 8 | -44 | 2 | 7 | 41 |
| Western Force | 14 | 7 | -25 | 1 | 7 | 36 |
| New South Wales Waratahs | 14 | 5 | -49 | 4 | 5 | 29 |
| Highlanders | 14 | 5 | -97 | 3 | 6 | 29 |
| Fijian Drua | 14 | 5 | -143 | 1 | 8 | 29 |
| Moana Pasifika | 14 | 2 | -291 | 1 | 2 | 11 |
Completed Match Review
| Model | Percent Correct Predictions | Spread Error |
|---|---|---|
| Club Level | 75.9% | 13.3 |
| Player Level: Lineup | nan% | nan |
| Player Level: Minutes | nan% | nan |
Future Predictions
Week 17
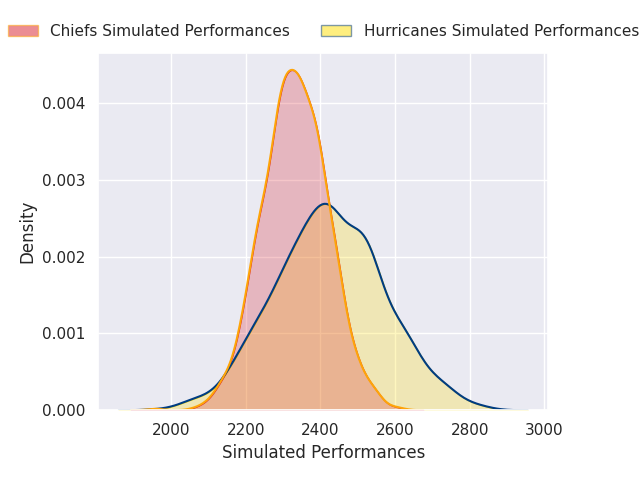
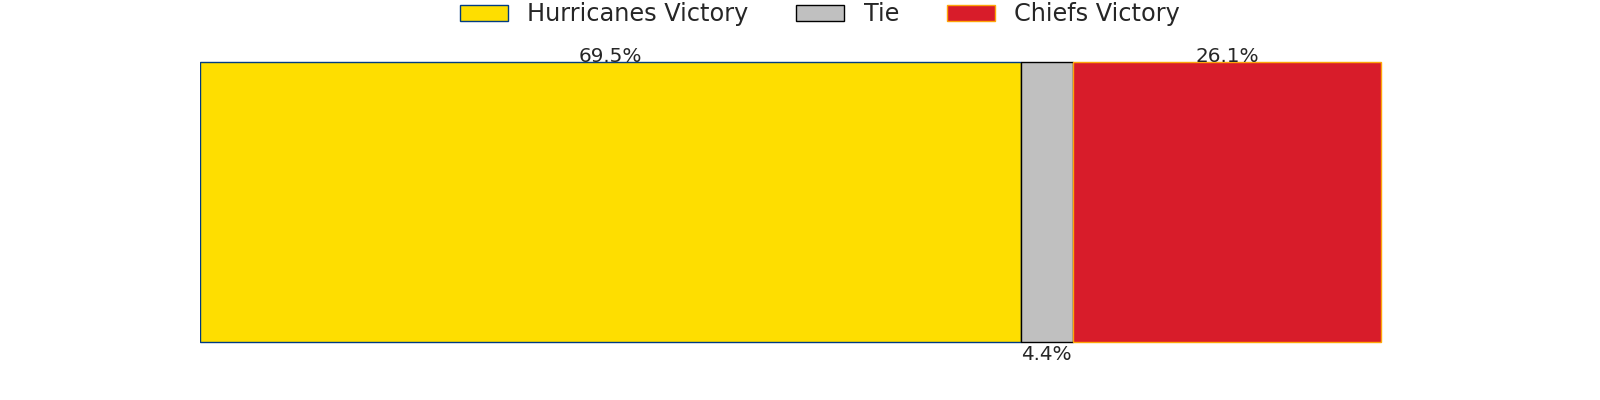
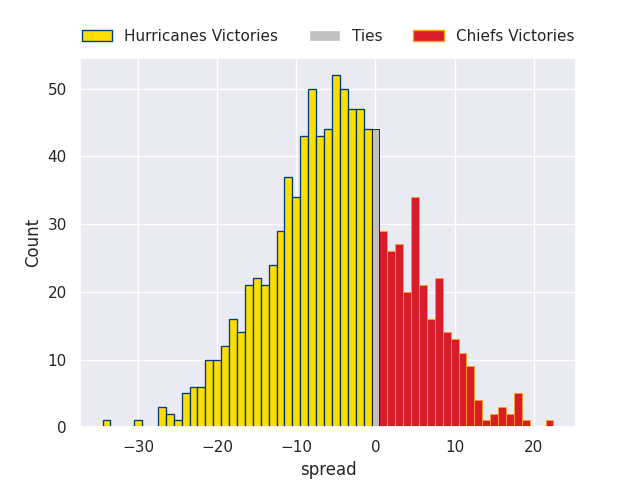
Hurricanes V Chiefs on 2026/06/20
Average Margin: Hurricanes by 4.6